Difference between revisions of "MATLAB:Fminbnd and fminsearch"
| Line 18: | Line 18: | ||
*LEFT_INDEP, RIGHT_INDEP represent the minimum and maximum value of the range over which you want to minimize the function. | *LEFT_INDEP, RIGHT_INDEP represent the minimum and maximum value of the range over which you want to minimize the function. | ||
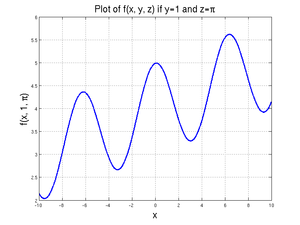
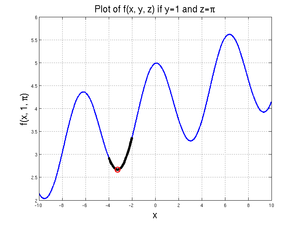
| + | [[File:FMBpageplot1.png|thumb|Plot showing the function on the domain between -10 and 10]] | ||
The example is based on wanting to determine minimum (and later, maximum) values of: | The example is based on wanting to determine minimum (and later, maximum) values of: | ||
<center><math>f(x, y, z)=\frac{x}{10}+\cos(x)+\sin(y)+z\,\!</math></center> | <center><math>f(x, y, z)=\frac{x}{10}+\cos(x)+\sin(y)+z\,\!</math></center> | ||
| − | We will assume that two of the three variables (<math>y</math> and <math>z</math>) are known and that we want to find <math>x</math> given those values. We will further assume that <math>y=1</math> and <math>z=\pi</math>. | + | We will assume that two of the three variables (<math>y</math> and <math>z</math>) are known and that we want to find <math>x</math> given those values. We will further assume that <math>y=1</math> and <math>z=\pi</math>. A graph of this function for values of <math>x</math> between -10 and 10 is shown at right. |
| + | <br clear=all> | ||
===== Function on the Fly ===== | ===== Function on the Fly ===== | ||
| − | If you only want to solve this problem once, and the calculation only requires one line of code, the process with the least "overhead" involves creating the function on the fly inside the <code>fzero</code> command. All you have to do is put your expression in for the FUNCTION_THING, making sure the DUMMY_VAR is appropriately used. You will also need to specify the boundary values. The line: | + | If you only want to solve this problem once, and the calculation only requires one line of code, the process with the least "overhead" involves creating the function on the fly inside the <code>fzero</code> command. All you have to do is put your expression in for the FUNCTION_THING, making sure the DUMMY_VAR is appropriately used. You will also need to specify the boundary values. |
| + | |||
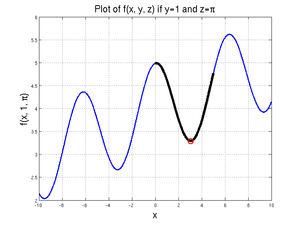
| + | [[File:FMBpageplot2.png|thumb|Plot focusing on domain between 0 and 5 showing minimum at 3.0414]] | ||
| + | The line: | ||
<source lang="matlab"> | <source lang="matlab"> | ||
[xValue, fValue] = fminbnd(@(xDummy) xDummy/10 + cos(xDummy) + sin(1) + pi, 0, 5) | [xValue, fValue] = fminbnd(@(xDummy) xDummy/10 + cos(xDummy) + sin(1) + pi, 0, 5) | ||
| Line 34: | Line 39: | ||
3.2922e+00 | 3.2922e+00 | ||
</source> | </source> | ||
| − | which has found the local minimum between <math>x=0</math> and <math>x=5</math>. Running the code: | + | which has found the local minimum between <math>x=0</math> and <math>x=5</math>. |
| + | <br clear=all> | ||
| + | |||
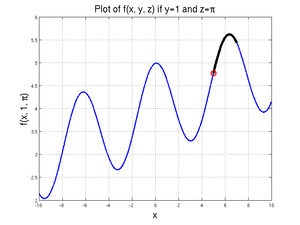
| + | [[File:FMBpageplot3.png|thumb|Plot focusing on domain between 5 and 7 showing minimum at 5.0000]] | ||
| + | Running the code: | ||
<source lang="matlab"> | <source lang="matlab"> | ||
[xValue, fValue] = fminbnd(@(xDummy) xDummy/10 + cos(xDummy) + sin(1) + pi, 5, 7) | [xValue, fValue] = fminbnd(@(xDummy) xDummy/10 + cos(xDummy) + sin(1) + pi, 5, 7) | ||
| Line 46: | Line 55: | ||
</source> | </source> | ||
since, for <math>x</math> values between 5 and 7, there is no local minimum. The value of the function at 5 is less than the value of the function at 7, so the 5 is returned. | since, for <math>x</math> values between 5 and 7, there is no local minimum. The value of the function at 5 is less than the value of the function at 7, so the 5 is returned. | ||
| + | <br clear=all> | ||
| + | |||
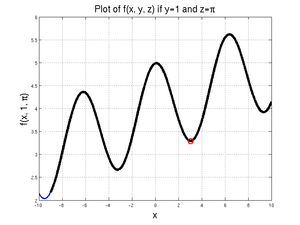
| + | [[File:FMBpageplot4.png|thumb|Plot focusing on domain between -9 and 10 showing "minimum" at 3.0414]] | ||
| + | [[File:FMBpageplot5.png|thumb|Plot focusing on domain between -4 and -3 showing minimum at -3.2418]] | ||
| + | |||
Finally, for | Finally, for | ||
<source lang="matlab"> | <source lang="matlab"> | ||
| Line 59: | Line 73: | ||
Note that this is not actually the "minimum" minimum - that would be at <math>x=-3.2418</math>, where the function is 2.6639, as given by | Note that this is not actually the "minimum" minimum - that would be at <math>x=-3.2418</math>, where the function is 2.6639, as given by | ||
<source lang="matlab"> | <source lang="matlab"> | ||
| − | [xValue, fValue] = fminbnd(@(xDummy) xDummy/10 + cos(xDummy) + sin(1) + pi, -4, - | + | [xValue, fValue] = fminbnd(@(xDummy) xDummy/10 + cos(xDummy) + sin(1) + pi, -4, -2) |
</source> | </source> | ||
| − | Furthermore, the actual minimum value of the function over | + | Furthermore, the actual minimum value of the function over the domain from -9 to 10 is given at <math>x=-9</math>, where <math>f=2.1719</math>; since MATLAB was able to find at least one local minimum, however, it did not check the boundary values. |
<!-- | <!-- | ||
Revision as of 18:10, 28 September 2013
The fminbnd command in MATLAB can be used to find the value of a single parameter of a multivariable function that will minimize the value of the function on some bounded domain. The command can only find one minimum at a time and can only find minima based on one variable at a time. If there is a single local minimum over the domain, fminbnd should find it. If there are several, it should find one of them, though it may not find the most minimum minima. If there is no local minimum in the range, fminbnd will return one of the boundary values, depending on where the function is at its minimum value for the domain.
There are several different ways to present fminbnd with the specific function and variable. In addition to the examples below, there is another page with more examples at MATLAB:Fminbnd/Examples.
Contents
Examples
Different Function Calls
Most General Case
The following examples show a method that will work regardless of how many input variables your function has or how you define your function - whether it is built-in, a variable containing an anonymous function, an anonymous function generated on the fly, or a .m file function. The paradigm is:
[INDEP_AT_MIN, FUNCTION_MIN] = fminbnd(@(DUMMY_VAR) FUNCTION_THING, LEFT_INDEP, RIGHT_INDEP)
where
- INDEP_AT_MIN is the calculated value of the requested variable when the function is at a minimum in the domain
- FUNCTION_MIN is the minimum value of the function at the INDEP_AT_MIN location
- DUMMY_VAR is the variable you want to use in this FUNCTION_THING to indicate which of the various inputs
fminbndis allowed to alter - FUNCTION_THING can be a built-in function, the name of an anonymous function, the name of a .m file function, or a calculation - whatever it is that you are trying to minimize; note that DUMMY_VAR must appear somewhere in this expression for
fminbndto be able to do anything - LEFT_INDEP, RIGHT_INDEP represent the minimum and maximum value of the range over which you want to minimize the function.
The example is based on wanting to determine minimum (and later, maximum) values of:
We will assume that two of the three variables (\(y\) and \(z\)) are known and that we want to find \(x\) given those values. We will further assume that \(y=1\) and \(z=\pi\). A graph of this function for values of \(x\) between -10 and 10 is shown at right.
Function on the Fly
If you only want to solve this problem once, and the calculation only requires one line of code, the process with the least "overhead" involves creating the function on the fly inside the fzero command. All you have to do is put your expression in for the FUNCTION_THING, making sure the DUMMY_VAR is appropriately used. You will also need to specify the boundary values.
The line:
[xValue, fValue] = fminbnd(@(xDummy) xDummy/10 + cos(xDummy) + sin(1) + pi, 0, 5)
will produce
xValue =
   3.0414e+00
fValue =
   3.2922e+00
which has found the local minimum between \(x=0\) and \(x=5\).
Running the code:
[xValue, fValue] = fminbnd(@(xDummy) xDummy/10 + cos(xDummy) + sin(1) + pi, 5, 7)
will produce
xValue =
   5.0000e+00
fValue =
   4.7668e+00
since, for \(x\) values between 5 and 7, there is no local minimum. The value of the function at 5 is less than the value of the function at 7, so the 5 is returned.
Finally, for
[xValue, fValue] = fminbnd(@(xDummy) xDummy/10 + cos(xDummy) + sin(1) + pi, -9, 10)
MATLAB returns:
xValue =
   3.0414e+00
fValue =
   3.2922e+00
Note that this is not actually the "minimum" minimum - that would be at \(x=-3.2418\), where the function is 2.6639, as given by
[xValue, fValue] = fminbnd(@(xDummy) xDummy/10 + cos(xDummy) + sin(1) + pi, -4, -2)
Furthermore, the actual minimum value of the function over the domain from -9 to 10 is given at \(x=-9\), where \(f=2.1719\); since MATLAB was able to find at least one local minimum, however, it did not check the boundary values.
