EGR 103/Fall 2017/Minilab 4
Jump to navigation
Jump to search
The following document is meant as an outline of what is covered in this assignment.
Contents
Typographical Errors
None yet!
Hints
- 4.6
- For (3), your CMD should be:
Data = load('data_NetID_001.dat');
- For (4), your CMD should still be:
Data = load('data_NetID_001.dat');
- For (5), your CMD values when k=1:3 should be:
Data = load('data_NetID_001.dat');
each time
- For (6), your CMD values when k=1:3 should be:
Data = load('data_NetID_001.dat');
Data = load('data_NetID_002.dat');
Data = load('data_NetID_003.dat');
respectively
- 4.7
- You will want to have something like
DataMax(k)=
DataMin(k)=
Delta(k)=
in your loop.
- You may have multiple places where the max max or min min lives; you can't (easily) print these out with a single fprintf statement - you will want a loop.
- 4.8
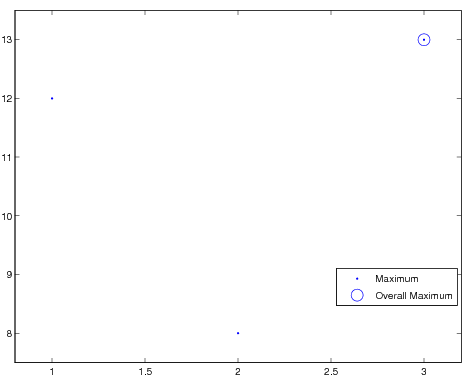
- You can graph all the DataMax dots in one plot command and all the locations of the max of DataMax circles in another plot command.
- 4.9
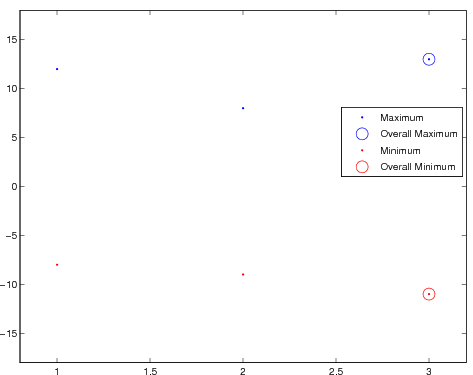
- Same as 4.8 for the minimums.
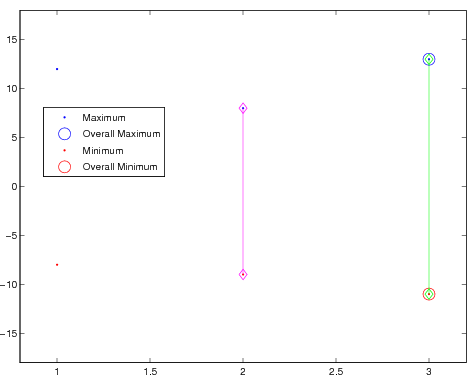
- For printing, you may have multiple places where the max delta or min delta lives; you can't (easily) print these out with a single fprintf statement - you will want a loop.
Data Analysis
Using NetID and 3 Files
Maximum value: 13
File with maximum value:
data_NetID_003.dat

Minimum value: -11
File with minimum value:
data_NetID_003.dat

Biggest difference: 24
File with largest difference:
data_NetID_003.dat

Smallest difference: 17
File with smallest difference:
data_NetID_002.dat
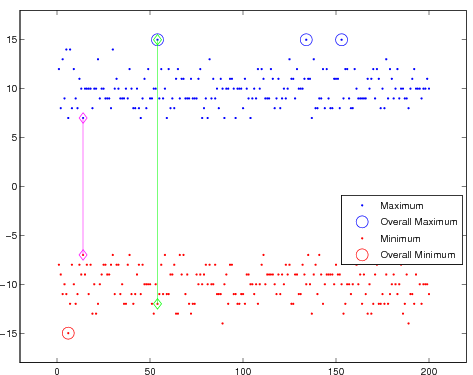
Using NetID and 200 Files
Maximum value: 15
Files with maximum value:
data_NetID_054.dat
data_NetID_134.dat
data_NetID_153.dat

Minimum value: -15
File with minimum value:
data_NetID_006.dat

Biggest difference: 27
File with largest difference:
data_NetID_054.dat

Smallest difference: 14
File with smallest difference:
data_NetID_014.dat
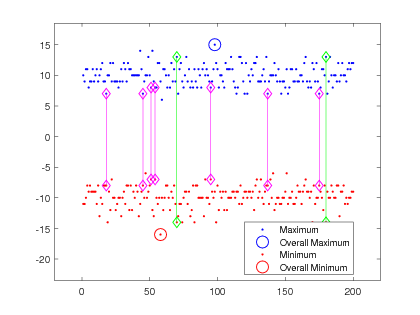
Using test9 and 200 Files
Maximum value: 15
File with maximum value:
data_test9_098.dat

Minimum value: -16
File with minimum value:
data_test9_058.dat

Biggest difference: 27
Files with largest difference:
data_test9_070.dat
data_test9_180.dat

Smallest difference: 15
Files with smallest difference:
data_test9_018.dat
data_test9_045.dat
data_test9_051.dat
data_test9_054.dat
data_test9_095.dat
data_test9_137.dat
data_test9_175.dat
Graphs
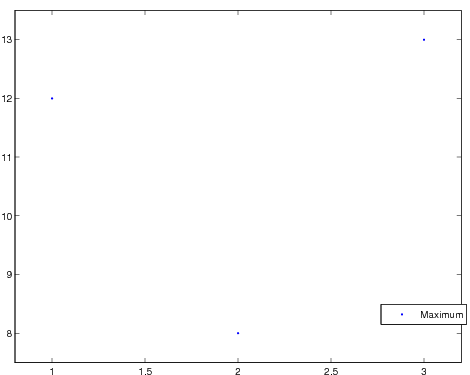
- Maximum values for three files
- Maximum values with overall maximum indicated
- Maximum and minimum with overall values indicated
- Same as above with largest and smallest differences indicated
- Same as above, but for 200 files
- Same as above, but using
test9as ID.
