DSPACE/Plots
This is a working draft of a page of instructions on how to add a plot to a ControlDesk layout.
Process
Add Instruments
In order to view and manipulate a plot, you will need to add two components from the instrument selector - specifically from the Data Acquisition section. Activate that group of instruments within the instrument selector, then select and draw
- A CaptureSettings box - this will need to be fairly large
- A PlotterArray box - this will hold your plot, so make it as large as you want your plot.
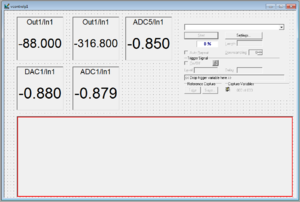
At right is an example of a layout with five displays, a CaptureSettings box, and a PlotterArray box.
Configure Instruments
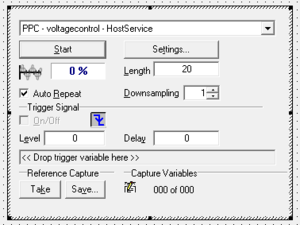
The CaptureSettings box needs to know from where the captured settings are coming. While in edit mode, the CaptureSettings box itself will be fairly inactive. To make changes, you will either need to double-click it or be in animation mode. Assuming you stay in edit mode, double-click the CaptureSettings box. Select the Capture tab and in the pull-down labeled Capture, select PPC - NAME - HostService where NAME will be the name of the SDF used in the layout. Click Apply and OK. The CaptureSettings window should now resemble the one at right.

