Pioneer/Imaging Lab 2
This page serves as a supplement to the second Digital Image Processing Labs for ECE 280. It has been updated for the Spring 2021 semester. This worksheet assumes you have done everything necessary to successfully complete Imaging Lab 1, including working with MATLAB and understanding basic image processing commands in MATLAB.
Corrections / Clarifications to the Handout
- None yet
Links
Examples
The following sections will contain both the example programs given in the lab as well as the image or images they produce. You should still type these into your own version of MATLAB to make sure you are getting the same answers. These are provided so you can compare what you get with what we think you should get.
Example 1: Signal Analysis
Since the point of Exercise 1 is to write the code to perform the calculations in this example, we'l.. just move right along to...
Example 2: MATLAB fft
x = [1, 5, 2, 3, 1]
X = fft(x)
yields
[12.0000 + 0.0000i, -1.1910 - 3.2164i, -2.3090 - 3.3022i, -2.3090 + 3.3022i, -1.1910 + 3.2164i
Example 3: MATLAB fft2 and ifft2
clear
x1 = [1, 1; 1, 1]
x2 = [1, 1; 0, 0]
x3 = [1, 0; 1, 0]
x4 = [1, 0; 0, 1]

X1=fft2(x1)
X2=fft2(x2)
X3=fft2(x3)
X4=fft2(x4)

x1a = ifft2(X1)
x2a = ifft2(X2)
x3a = ifft2(X3)
x4a = ifft2(X4)
yields:
x1 =

     1     1
     1     1


x2 =

     1     1
     0     0


x3 =

     1     0
     1     0


x4 =

     1     0
     0     1


X1 =

     4     0
     0     0


X2 =

     2     0
     2     0


X3 =

     2     2
     0     0


X4 =

     2     0
     0     2


x1a =

     1     1
     1     1


x2a =

     1     1
     0     0


x3a =

     1     0
     1     0


x4a =

     1     0
     0     1
Example 4: One-Dimensional Frequency Mapping
M = 15;
for m=0:((M+1)/2-1)
    Xm = zeros(M,1);
    Xm(m+1) = M/2;
    if m==0
        Xm(m+1)= M;
    else
        Xm(M+1-m) = M/2;
    end
    x = ifft(Xm);
    figure(m+1); clf
    bar(x)
end
-
![Xm=[15, 0, 0, 0, 0, 0, 0, 0, 0, 0, 0, 0, 0, 0, 0]](/piki_143/images/thumb/a/a5/IP2_E4_Plot1.png/120px-IP2_E4_Plot1.png) Xm=[15, 0, 0, 0, 0, 0, 0, 0, 0, 0, 0, 0, 0, 0, 0]
Xm=[15, 0, 0, 0, 0, 0, 0, 0, 0, 0, 0, 0, 0, 0, 0] -
![Xm=[0, 7.5, 0, 0, 0, 0, 0, 0, 0, 0, 0, 0, 0, 0, 7.5]](/piki_143/images/thumb/0/0c/IP2_E4_Plot2.png/120px-IP2_E4_Plot2.png) Xm=[0, 7.5, 0, 0, 0, 0, 0, 0, 0, 0, 0, 0, 0, 0, 7.5]
Xm=[0, 7.5, 0, 0, 0, 0, 0, 0, 0, 0, 0, 0, 0, 0, 7.5] -
![Xm=[0, 0, 7.5, 0, 0, 0, 0, 0, 0, 0, 0, 0, 0, 7.5, 0]](/piki_143/images/thumb/5/51/IP2_E4_Plot3.png/120px-IP2_E4_Plot3.png) Xm=[0, 0, 7.5, 0, 0, 0, 0, 0, 0, 0, 0, 0, 0, 7.5, 0]
Xm=[0, 0, 7.5, 0, 0, 0, 0, 0, 0, 0, 0, 0, 0, 7.5, 0] -
![Xm=[0, 0, 0, 7.5, 0, 0, 0, 0, 0, 0, 0, 0, 7.5, 0, 0]](/piki_143/images/thumb/a/ac/IP2_E4_Plot4.png/120px-IP2_E4_Plot4.png) Xm=[0, 0, 0, 7.5, 0, 0, 0, 0, 0, 0, 0, 0, 7.5, 0, 0]
Xm=[0, 0, 0, 7.5, 0, 0, 0, 0, 0, 0, 0, 0, 7.5, 0, 0]
![Xm=[15, 0, 0, 0, 0, 0, 0, 0, 0, 0, 0, 0, 0, 0, 0]](/piki_143/wiki/File:IP2_E4_Plot1.png)
![Xm=[0, 7.5, 0, 0, 0, 0, 0, 0, 0, 0, 0, 0, 0, 0, 7.5]](/piki_143/wiki/File:IP2_E4_Plot2.png)
![Xm=[0, 0, 7.5, 0, 0, 0, 0, 0, 0, 0, 0, 0, 0, 7.5, 0]](/piki_143/wiki/File:IP2_E4_Plot3.png)
![Xm=[0, 0, 0, 7.5, 0, 0, 0, 0, 0, 0, 0, 0, 7.5, 0, 0]](/piki_143/wiki/File:IP2_E4_Plot4.png)
-
![Xm=[0, 0, 0, 0, 7.5, 0, 0, 0, 0, 0, 0, 7.5, 0, 0, 0]](/piki_143/images/thumb/4/4c/IP2_E4_Plot5.png/120px-IP2_E4_Plot5.png) Xm=[0, 0, 0, 0, 7.5, 0, 0, 0, 0, 0, 0, 7.5, 0, 0, 0]
Xm=[0, 0, 0, 0, 7.5, 0, 0, 0, 0, 0, 0, 7.5, 0, 0, 0] -
![Xm=[0, 0, 0, 0, 0, 7.5, 0, 0, 0, 0, 7.5, 0, 0, 0, 0]](/piki_143/images/thumb/0/06/IP2_E4_Plot6.png/120px-IP2_E4_Plot6.png) Xm=[0, 0, 0, 0, 0, 7.5, 0, 0, 0, 0, 7.5, 0, 0, 0, 0]
Xm=[0, 0, 0, 0, 0, 7.5, 0, 0, 0, 0, 7.5, 0, 0, 0, 0] -
![Xm=[0, 0, 0, 0, 0, 0, 7.5, 0, 0, 7.5, 0, 0, 0, 0, 0]](/piki_143/images/thumb/e/ea/IP2_E4_Plot7.png/120px-IP2_E4_Plot7.png) Xm=[0, 0, 0, 0, 0, 0, 7.5, 0, 0, 7.5, 0, 0, 0, 0, 0]
Xm=[0, 0, 0, 0, 0, 0, 7.5, 0, 0, 7.5, 0, 0, 0, 0, 0] -
![Xm=[0, 0, 0, 0, 0, 0, 0, 7.5, 7.5, 0, 0, 0, 0, 0, 0]](/piki_143/images/thumb/d/d3/IP2_E4_Plot8.png/120px-IP2_E4_Plot8.png) Xm=[0, 0, 0, 0, 0, 0, 0, 7.5, 7.5, 0, 0, 0, 0, 0, 0]
Xm=[0, 0, 0, 0, 0, 0, 0, 7.5, 7.5, 0, 0, 0, 0, 0, 0]
![Xm=[0, 0, 0, 0, 7.5, 0, 0, 0, 0, 0, 0, 7.5, 0, 0, 0]](/piki_143/wiki/File:IP2_E4_Plot5.png)
![Xm=[0, 0, 0, 0, 0, 7.5, 0, 0, 0, 0, 7.5, 0, 0, 0, 0]](/piki_143/wiki/File:IP2_E4_Plot6.png)
![Xm=[0, 0, 0, 0, 0, 0, 7.5, 0, 0, 7.5, 0, 0, 0, 0, 0]](/piki_143/wiki/File:IP2_E4_Plot7.png)
![Xm=[0, 0, 0, 0, 0, 0, 0, 7.5, 7.5, 0, 0, 0, 0, 0, 0]](/piki_143/wiki/File:IP2_E4_Plot8.png)
Example 4a: One-Dimensional Frequency Mapping (Odd Symmetry)
M = 15;
for m=0:((M+1)/2-1)
    Xm = zeros(M,1);
    Xm(m+1) = M/2/j;
    if m==0
        Xm(m+1)= M;
    else
        Xm(M+1-m) = -M/2/j;
    end
    x = ifft(Xm);
    figure(m+1); clf
    bar(x)
end
-
![Xm=[15, 0, 0, 0, 0, 0, 0, 0, 0, 0, 0, 0, 0, 0, 0]](/piki_143/images/thumb/2/28/IP2_E4a_Plot1.png/120px-IP2_E4a_Plot1.png) Xm=[15, 0, 0, 0, 0, 0, 0, 0, 0, 0, 0, 0, 0, 0, 0]
Xm=[15, 0, 0, 0, 0, 0, 0, 0, 0, 0, 0, 0, 0, 0, 0] -
![Xm=[0, 7.5, 0, 0, 0, 0, 0, 0, 0, 0, 0, 0, 0, 0, 7.5]](/piki_143/images/thumb/4/43/IP2_E4a_Plot2.png/120px-IP2_E4a_Plot2.png) Xm=[0, 7.5, 0, 0, 0, 0, 0, 0, 0, 0, 0, 0, 0, 0, 7.5]
Xm=[0, 7.5, 0, 0, 0, 0, 0, 0, 0, 0, 0, 0, 0, 0, 7.5] -
![Xm=[0, 0, 7.5, 0, 0, 0, 0, 0, 0, 0, 0, 0, 0, 7.5, 0]](/piki_143/images/thumb/3/38/IP2_E4a_Plot3.png/120px-IP2_E4a_Plot3.png) Xm=[0, 0, 7.5, 0, 0, 0, 0, 0, 0, 0, 0, 0, 0, 7.5, 0]
Xm=[0, 0, 7.5, 0, 0, 0, 0, 0, 0, 0, 0, 0, 0, 7.5, 0] -
![Xm=[0, 0, 0, 7.5, 0, 0, 0, 0, 0, 0, 0, 0, 7.5, 0, 0]](/piki_143/images/thumb/4/42/IP2_E4a_Plot4.png/120px-IP2_E4a_Plot4.png) Xm=[0, 0, 0, 7.5, 0, 0, 0, 0, 0, 0, 0, 0, 7.5, 0, 0]
Xm=[0, 0, 0, 7.5, 0, 0, 0, 0, 0, 0, 0, 0, 7.5, 0, 0]
![Xm=[15, 0, 0, 0, 0, 0, 0, 0, 0, 0, 0, 0, 0, 0, 0]](/piki_143/wiki/File:IP2_E4a_Plot1.png)
![Xm=[0, 7.5, 0, 0, 0, 0, 0, 0, 0, 0, 0, 0, 0, 0, 7.5]](/piki_143/wiki/File:IP2_E4a_Plot2.png)
![Xm=[0, 0, 7.5, 0, 0, 0, 0, 0, 0, 0, 0, 0, 0, 7.5, 0]](/piki_143/wiki/File:IP2_E4a_Plot3.png)
![Xm=[0, 0, 0, 7.5, 0, 0, 0, 0, 0, 0, 0, 0, 7.5, 0, 0]](/piki_143/wiki/File:IP2_E4a_Plot4.png)
-
![Xm=[0, 0, 0, 0, 7.5, 0, 0, 0, 0, 0, 0, 7.5, 0, 0, 0]](/piki_143/images/thumb/a/ad/IP2_E4a_Plot5.png/120px-IP2_E4a_Plot5.png) Xm=[0, 0, 0, 0, 7.5, 0, 0, 0, 0, 0, 0, 7.5, 0, 0, 0]
Xm=[0, 0, 0, 0, 7.5, 0, 0, 0, 0, 0, 0, 7.5, 0, 0, 0] -
![Xm=[0, 0, 0, 0, 0, 7.5, 0, 0, 0, 0, 7.5, 0, 0, 0, 0]](/piki_143/images/thumb/c/cd/IP2_E4a_Plot6.png/120px-IP2_E4a_Plot6.png) Xm=[0, 0, 0, 0, 0, 7.5, 0, 0, 0, 0, 7.5, 0, 0, 0, 0]
Xm=[0, 0, 0, 0, 0, 7.5, 0, 0, 0, 0, 7.5, 0, 0, 0, 0] -
![Xm=[0, 0, 0, 0, 0, 0, 7.5, 0, 0, 7.5, 0, 0, 0, 0, 0]](/piki_143/images/thumb/c/cb/IP2_E4a_Plot7.png/120px-IP2_E4a_Plot7.png) Xm=[0, 0, 0, 0, 0, 0, 7.5, 0, 0, 7.5, 0, 0, 0, 0, 0]
Xm=[0, 0, 0, 0, 0, 0, 7.5, 0, 0, 7.5, 0, 0, 0, 0, 0] -
![Xm=[0, 0, 0, 0, 0, 0, 0, 7.5, 7.5, 0, 0, 0, 0, 0, 0]](/piki_143/images/thumb/6/6f/IP2_E4a_Plot8.png/120px-IP2_E4a_Plot8.png) Xm=[0, 0, 0, 0, 0, 0, 0, 7.5, 7.5, 0, 0, 0, 0, 0, 0]
Xm=[0, 0, 0, 0, 0, 0, 0, 7.5, 7.5, 0, 0, 0, 0, 0, 0]
![Xm=[0, 0, 0, 0, 7.5, 0, 0, 0, 0, 0, 0, 7.5, 0, 0, 0]](/piki_143/wiki/File:IP2_E4a_Plot5.png)
![Xm=[0, 0, 0, 0, 0, 7.5, 0, 0, 0, 0, 7.5, 0, 0, 0, 0]](/piki_143/wiki/File:IP2_E4a_Plot6.png)
![Xm=[0, 0, 0, 0, 0, 0, 7.5, 0, 0, 7.5, 0, 0, 0, 0, 0]](/piki_143/wiki/File:IP2_E4a_Plot7.png)
![Xm=[0, 0, 0, 0, 0, 0, 0, 7.5, 7.5, 0, 0, 0, 0, 0, 0]](/piki_143/wiki/File:IP2_E4a_Plot8.png)
Example 5: MATLAB fft2 and ifft2 for Even Dimensions
x1 = [3, 4, 5, 7; 9, 7, 5, 3; 1, 8, 6, 7; 4, 2, 7, 6]
X1 = fft2(x1)
yields
and
fftshift(X1)
yields
where the matching colors denote the requisite complex conjugate pairs.
Example 6: FFT of Coins
x = imread('coins.png');
x = x(2:end, 2:end);
figure(1); clf
image(x); axis equal; colormap gray; colorbar
X = fft2(x);
Xs = fftshift(X);
figure(2); clf
imagesc(abs(X)); axis equal; colormap gray; colorbar
figure(3); clf
imagesc(abs(Xs)); axis equal; colormap gray; colorbar
figure(4); clf
imagesc(log10(abs(Xs))); axis equal; colormap gray; colorbar

Xnodc = fft2(x); Xnodc(1,1) = 0;
Xnodcs = fftshift(Xnodc);
figure(5); clf
imagesc(abs(Xnodcs)); axis equal; colormap gray; colorbar
figure(6); clf
imagesc(log10(abs(Xnodcs))); axis equal; colormap gray; colorbar
-
 Original
 -
 Magnitude of fft
 -
 Shifted Magnitude
 -
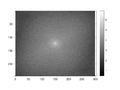 log of Shifted Magnitude
 -
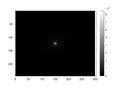 Shifted Magnitude sans DC
 -
 log of Shifted Magnitude sans DC


Example 7: Round LPF Applied to Coins
x = imread('coins.png');
x = x(2:end, 2:end);
figure(1); clf
image(x); axis equal; colormap gray; colorbar

X = fft2(x);
Xs = fftshift(X);
figure(2); clf
imagesc(log10(abs(Xs))); axis equal; colormap gray; colorbar

[rows, cols] = size(x);
max_size = max(rows, cols);
rnorm = rows/max_size; cnorm = cols/max_size;
[v, u] = meshgrid(linspace(-cnorm, cnorm, cols),...
    linspace(-rnorm, rnorm, rows)) ;
filter = sqrt(u.^2+v.^2)<0.5;
figure(3); clf
imagesc(filter); axis equal; colormap gray; colorbar

Xsfiltered = Xs.*filter;
figure(4); clf
imagesc(log10(abs(Xsfiltered))); axis equal; colormap gray; colorbar

Xfiltered = ifftshift(Xsfiltered);
xfiltered = ifft2(Xfiltered);
figure(5); clf
imagesc(xfiltered, [0, 255]); axis equal; colormap gray; colorbar
-
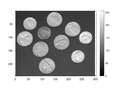 Original
 -
 log of Shifted Magnitude
 -
 Filter Magnitude
 -
 log of Filtered Shifted Magnitude
 -
 Filtered Image


Example 8: Rectangular LPF Applied to Coins
x = imread('coins.png');
x = x(2:end, 2:end);
figure(1); clf
image(x); axis equal; colormap gray; colorbar

X = fft2(x);
Xs = fftshift(X);
figure(2); clf
imagesc(log10(abs(Xs))); axis equal; colormap gray; colorbar

[rows, cols] = size(x);
max_size = max(rows, cols);
rnorm = rows/max_size; cnorm = cols/max_size;
[v, u] = meshgrid(linspace(-cnorm, cnorm, cols),...
    linspace(-rnorm, rnorm, rows)) ;
filter = (abs(u)<0.5) & (abs(v)<0.5);
figure(3); clf
imagesc(filter); axis equal; colormap gray; colorbar

Xsfiltered = Xs.*filter;
figure(4); clf
imagesc(log10(abs(Xsfiltered))); axis equal; colormap gray; colorbar

Xfiltered = ifftshift(Xsfiltered);
xfiltered = ifft2(Xfiltered);
figure(5); clf
imagesc(xfiltered, [0, 255]); axis equal; colormap gray; colorbar
-
 Original
 -
 log of Shifted Magnitude
 -
 Filter Magnitude
 -
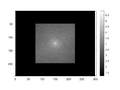 log of Filtered Shifted Magnitude
 -
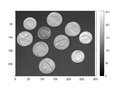 Filtered Image


Example 9: Rectangular HPF Applied to Coins
x = imread('coins.png');
x = x(2:end, 2:end);
figure(1); clf
image(x); axis equal; colormap gray; colorbar

X = fft2(x);
Xs = fftshift(X);
figure(2); clf
imagesc(log10(abs(Xs))); axis equal; colormap gray; colorbar

[rows, cols] = size(x);
max_size = max(rows, cols);
rnorm = rows/max_size; cnorm = cols/max_size;
[v, u] = meshgrid(linspace(-cnorm, cnorm, cols),...
    linspace(-rnorm, rnorm, rows)) ;
filter = (abs(u)>0.1) | (abs(v)>0.1);
figure(3); clf
imagesc(filter); axis equal; colormap gray; colorbar

Xsfiltered = Xs.*filter;
figure(4); clf
imagesc(log10(abs(Xsfiltered))); axis equal; colormap gray; colorbar

Xfiltered = ifftshift(Xsfiltered);
xfiltered = ifft2(Xfiltered);
figure(5); clf
imagesc(xfiltered); axis equal; colormap gray; colorbar
-
 Original
 -
 log of Shifted Magnitude
 -
 Filter Magnitude
 -
 log of Filtered Shifted Magnitude
 -
 Filtered Image


