Difference between revisions of "EGR 103/DAQ 2"
| Line 2: | Line 2: | ||
==Notes == | ==Notes == | ||
| − | |||
| − | |||
| − | |||
| − | |||
| − | |||
| − | |||
| − | |||
=== Pauses === | === Pauses === | ||
There are <code>pause</code> commands in the code which will cause the program to...pause - specifically when the program first runs to check the lights. You will need to hit a key to un-pause the program. The way to see if the program is paused is to look at the bottom left corner of your MATLAB window - it will tell you if it is paused. | There are <code>pause</code> commands in the code which will cause the program to...pause - specifically when the program first runs to check the lights. You will need to hit a key to un-pause the program. The way to see if the program is paused is to look at the bottom left corner of your MATLAB window - it will tell you if it is paused. | ||
Revision as of 22:06, 19 October 2012
This page contains pictures and graphs related to DAQ 2 for EGR 103. It has been updated for Fall, 2012.
Contents
Notes
Pauses
There are pause commands in the code which will cause the program to...pause - specifically when the program first runs to check the lights. You will need to hit a key to un-pause the program. The way to see if the program is paused is to look at the bottom left corner of your MATLAB window - it will tell you if it is paused.
Graph Labels
For this particular assignment, you do not need axis labels. You need a title on each subplot, however.
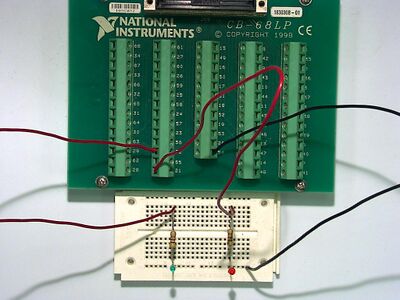
Circuit for BasicAOutput
Circuit layout for BasicAOutput.
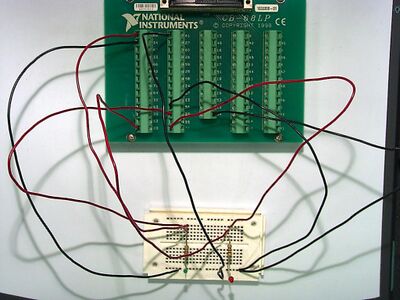
Circuit for BasicAIO
Circuit layout for BasicAIO (two measurements).
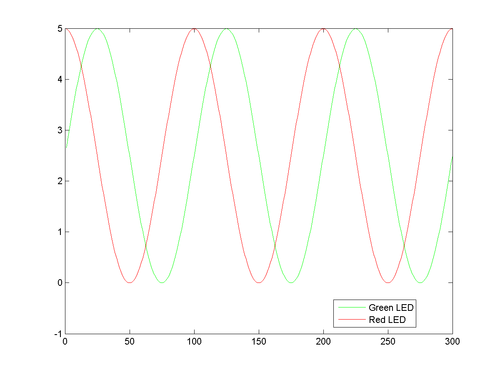
Graph from BasicAIO
Graph showing outputs when
Vout0 = 2.5+2.5*sin(2*pi*k/100);
Vout1 = 2.5+2.5*cos(2*pi*k/100);
That is,
\( \begin{align} V_{out,\,0}=2.5+2.5\sin\left(\frac{2\pi k}{100}\right)\\ V_{out,\,1}=2.5+2.5\cos\left(\frac{2\pi k}{100}\right) \end{align} \)
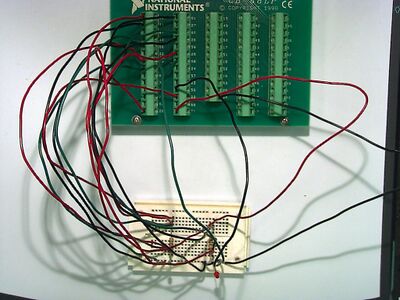
Circuit for AIO
Circuit layout for AIO (six measurements).
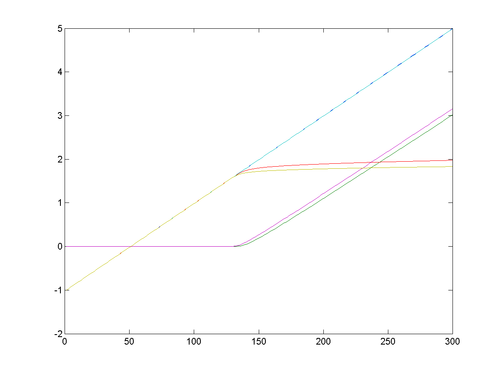
Graph from AIO
Graph showing outputs from six measurement channels.
Codes
Pasting codes from PDF files is...a bad idea. Here are the text versions of some of the codes in the assignment.
Example Commands to Parse Data Set for Small Green and Red LEDs
load SmallData
SmallGreenTotal = SmallVoltages(:,1);
SmallGreenRes   = SmallVoltages(:,2);
SmallGreenLED   = SmallVoltages(:,3);
SmallRedTotal   = SmallVoltages(:,4);
SmallRedRes     = SmallVoltages(:,5);
SmallRedLED     = SmallVoltages(:,6);
Subplot Structure for Plotting Code
The code below includes the commands for the small green LED assuming the variable names given in the code above.
subplot(3,2,1)
% small green plotting commands
plot(SmallGreenTotal, SmallGreenTotal, 'k-',...
     SmallGreenTotal, SmallGreenRes,   'k:',...
     SmallGreenTotal, SmallGreenLED,   'k--')
title('Small Green LED')
grid on

subplot(3,2,2)
% small red plotting commands

subplot(3,2,3)
% large green plotting commands

subplot(3,2,4)
% large red plotting commands

subplot(3,2,5)
% rect green plotting commands

subplot(3,2,6)
% rect red plotting commands
Questions
Post your questions by editing the discussion page of this article. Edit the page, then scroll to the bottom and add a question by putting in the characters *{{Q}}, followed by your question and finally your signature (with four tildes, i.e. ~~~~). Using the {{Q}} will automatically put the page in the category of pages with questions - other editors hoping to help out can then go to that category page to see where the questions are. See the page for Template:Q for details and examples.
