Difference between revisions of "MATLAB:Plotting Surfaces"
| (12 intermediate revisions by 2 users not shown) | |||
| Line 4: | Line 4: | ||
to think about both the ''x'' and ''y'' coordinate. There are various | to think about both the ''x'' and ''y'' coordinate. There are various | ||
other functions that need ''x'' and ''y'' coordinates. | other functions that need ''x'' and ''y'' coordinates. | ||
| + | |||
| + | |||
| + | == Note For MAC People == | ||
| + | There is a known graphics issue once a surface has too many nodes. If you get an infinite "Busy" warning or an error about libGL, you need to start your figure with: | ||
| + | <source lang=matlab> | ||
| + | figure(1) | ||
| + | clf | ||
| + | set(gcf, 'Renderer', 'ZBuffer') | ||
| + | </source> | ||
| + | You may choose to just do this in general for surf, surfc, mesh, or meshc plots to avoid the infinite business error. | ||
| + | |||
| + | == Individual Patches == | ||
| + | One way to create a surface is to generate lists of the x, y, and z coordinates for each location of a patch. MATLAB will plot intersections at each location specified by the matrices and will then connect the intersections by linking the values next to each other in the matrix. For example, if x, y, and z are 2x2 matrices, the surface commands will generate a single patch: | ||
| + | <source lang=matlab> | ||
| + | clear; format short e | ||
| + | x = [ 1 3;... | ||
| + | 2 4]; | ||
| + | y = [ 5 6;... | ||
| + | 7 8]; | ||
| + | z = [ 9 12;... | ||
| + | 10 11] | ||
| + | meshc(x, y, z) | ||
| + | xlabel('x'); ylabel('y'); zlabel('z'); | ||
| + | axis equal; axis([1 6 5 9 9 12]) | ||
| + | </source> | ||
| + | <center> | ||
| + | [[File:PatchExOrig.png|400 px]] | ||
| + | </center> | ||
| + | |||
| + | Note that the four "corners" above are not all co-planar; MATLAB will thus create the patch using two triangles - to show this more clearly, you can tell MATLAB to change the view by specifying the azimuth and elevation: | ||
| + | <source lang=matlab> | ||
| + | view([136, 32]) | ||
| + | </source> | ||
| + | which yields the following image: | ||
| + | <center> | ||
| + | [[File:PatchExRot.png|400 px]] | ||
| + | </center> | ||
| + | |||
| + | You can add more patches to the surface by increasing the size of the matrices. For example, adding another column will add two more intersections to the surface: | ||
| + | <source lang="matlab"> | ||
| + | x = [x [ 5; 6]]; | ||
| + | y = [y [ 5; 9]]; | ||
| + | z = [z [12; 12]]; | ||
| + | meshc(x, y, z) | ||
| + | xlabel('x'); ylabel('y'); zlabel('z'); | ||
| + | axis equal; axis([1 6 5 9 9 12]) | ||
| + | </source> | ||
| + | <center> | ||
| + | [[File:PatchExTwo.png|400 px]] | ||
| + | </center> | ||
== The meshgrid Command== | == The meshgrid Command== | ||
| − | The '''meshgrid''' command is specifically used to create matrices that will represent | + | Much of the time, rather than specifying individual patches, you will have functions of two parameters to plot. The '''meshgrid''' command is specifically used to create matrices that will represent two parameters. For example, note the output to the |
| − | |||
following MATLAB command: | following MATLAB command: | ||
<source lang="matlab"> | <source lang="matlab"> | ||
| Line 46: | Line 95: | ||
== Examples Using 2 Independent Variables == | == Examples Using 2 Independent Variables == | ||
| − | For example, to plot <code>z=x+y<code> over the ranges of <code>x<code> | + | For example, to plot <code>z=x+y</code> over the ranges of <code>x</code> |
| − | and <code>y<code> specified above - the code would be: | + | and <code>y</code> specified above - the code would be: |
<source lang="matlab"> | <source lang="matlab"> | ||
| + | [x, y] = meshgrid(-2:1:2, -1:.25:1); | ||
z = x + y; | z = x + y; | ||
| − | + | meshc(x, y, z); | |
xlabel('x'); | xlabel('x'); | ||
ylabel('y'); | ylabel('y'); | ||
| Line 68: | Line 118: | ||
the code could be: | the code could be: | ||
<source lang="matlab"> | <source lang="matlab"> | ||
| + | [x, y] = meshgrid(-2:1:2, -1:.25:1); | ||
r = sqrt( (x-(-1)).^2 + (y-(-0.5)).^2 ); | r = sqrt( (x-(-1)).^2 + (y-(-0.5)).^2 ); | ||
| − | + | meshc(x, y, r); | |
xlabel('x'); | xlabel('x'); | ||
ylabel('y'); | ylabel('y'); | ||
| Line 82: | Line 133: | ||
== Examples Using Refined Grids == | == Examples Using Refined Grids == | ||
You can also use a finer grid to make a better-looking plot: | You can also use a finer grid to make a better-looking plot: | ||
| − | + | <source lang="matlab"> | |
[x, y] = meshgrid(linspace(-1.2, 1.2, 20)); | [x, y] = meshgrid(linspace(-1.2, 1.2, 20)); | ||
r = sqrt( (x-(-1)).^2 + (y-(-0.5)).^2 ); | r = sqrt( (x-(-1)).^2 + (y-(-0.5)).^2 ); | ||
| − | + | meshc(x, y, r); | |
xlabel('x'); | xlabel('x'); | ||
ylabel('y'); | ylabel('y'); | ||
| Line 96: | Line 147: | ||
</center> | </center> | ||
| − | Note that the <code>meshgrid | + | Note that the <code>meshgrid</code> command was given only one |
argument - in that case, the range of <code>x</code> and <code>y</code> will be the same. | argument - in that case, the range of <code>x</code> and <code>y</code> will be the same. | ||
| Line 126: | Line 177: | ||
1.2000 | 1.2000 | ||
</source> | </source> | ||
| + | |||
| + | You can also use the two-output version of the <code>max</code> and <code>min</code> commands: | ||
| + | <source lang="matlab"> | ||
| + | [MinDistance, MinIndex] = min(r(:)) | ||
| + | [MaxDistance, MaxIndex] = max(r(:)) | ||
| + | XatMin = x(MinIndex) | ||
| + | YatMin = y(MinIndex) | ||
| + | XatMax = x(MaxIndex) | ||
| + | YatMax = y(MaxIndex) | ||
| + | </source> | ||
| + | Fortunately, because of the way MATLAB pulls the elements from a matrix to a single column, the element numbers for the relevant x and y values will be the same. | ||
If there are multiple maxima or minima, the <code>find</code> command will | If there are multiple maxima or minima, the <code>find</code> command will | ||
| Line 132: | Line 194: | ||
[x, y] = meshgrid(linspace(-1, 1, 31)); | [x, y] = meshgrid(linspace(-1, 1, 31)); | ||
z2 = exp(-sqrt(x.^2+y.^2)).*cos(4*x).*cos(4*y); | z2 = exp(-sqrt(x.^2+y.^2)).*cos(4*x).*cos(4*y); | ||
| − | + | meshc(x, y, z2); | |
xlabel('x'); | xlabel('x'); | ||
ylabel('y'); | ylabel('y'); | ||
| Line 223: | Line 285: | ||
== Using Other Coordinate Systems == | == Using Other Coordinate Systems == | ||
| − | The plotting commands such as <code> | + | The plotting commands such as <code>meshc</code> and <code>surfc</code> generate surfaces based on matrices of x, y, and z coordinates, respectively, but you can also use other coordinate systems to calculate where the points go. As an example, the surface above could be plotted on a circular domain using polar coordinates. To do that, ''r'' and <math>\theta</math> coordinates could be generated using meshgrid and the appropriate x, y, and z values could be obtained by noting that <math>x=r\cos(\theta)</math> and <math>y=r\sin(\theta)</math>. z can then be calculated from any combination of x, y, r, and <math>\theta</math>: |
<source lang="matlab"> | <source lang="matlab"> | ||
[r, theta] = meshgrid(... | [r, theta] = meshgrid(... | ||
linspace(0, 1.7, 60), ... | linspace(0, 1.7, 60), ... | ||
linspace(0, 2*pi, 73)); | linspace(0, 2*pi, 73)); | ||
| − | + | x = r.*cos(theta); | |
| − | + | y = r.*sin(theta); | |
| − | + | z = exp(-r).*cos(4*x).*cos(4*y); | |
| − | + | meshc(x, y, z); | |
| − | + | x('x'); | |
| − | + | y('y'); | |
| − | + | z('z'); | |
</source> | </source> | ||
produces: | produces: | ||
| Line 242: | Line 304: | ||
though in this case, an interpolated surface plot might look better: | though in this case, an interpolated surface plot might look better: | ||
<source lang="matlab"> | <source lang="matlab"> | ||
| − | + | surfc(x, y, z); | |
shading interp | shading interp | ||
xlabel('x'); | xlabel('x'); | ||
| Line 252: | Line 314: | ||
</center> | </center> | ||
| + | == Color Maps and Color Bars == | ||
| + | When printing to a black-and-white printer, it might make sense to change the color scheme to grayscale or something other than the default case. The <code>colormap</code> command does this. The different color maps are listed in the help file for <code>color map</code>, as are instructions for how to make your own colormap if you need to. | ||
| + | Along with using a different color map, you may want to add a color bar to indicate the values assigned to particular colors. This may be done using the <code>colorbar</code> command. Continuing on with the examples above: | ||
| + | <source lang="matlab"> | ||
| + | [r, theta] = meshgrid(... | ||
| + | linspace(0, 1.7, 60), ... | ||
| + | linspace(0, 2*pi, 73)); | ||
| + | x = r.*cos(theta); | ||
| + | y = r.*sin(theta); | ||
| + | z = exp(-r).*cos(4*x).*cos(4*y); | ||
| + | meshc(x, y, z); | ||
| + | colormap(gray) | ||
| + | colorbar | ||
| + | x('x'); | ||
| + | y('y'); | ||
| + | z('z'); | ||
| + | </source> | ||
| + | produces: | ||
| + | <center> | ||
| + | [[Image:SurfExp07a.png|400px]] | ||
| + | </center> | ||
| + | and for the interpolated surface plot: | ||
| + | <source lang="matlab"> | ||
| + | surfc(x, y, z); | ||
| + | shading interp | ||
| + | colormap(gray) | ||
| + | colorbar | ||
| + | xlabel('x'); | ||
| + | ylabel('y'); | ||
| + | zlabel('z'); | ||
| + | </source> | ||
| + | <center> | ||
| + | [[Image:SurfExp07b.png|400px]] | ||
| + | </center> | ||
| + | |||
| + | == Contour Plots == | ||
| + | Information on making contour plots is at [[MATLAB:Contour Plots]]. | ||
== Questions == | == Questions == | ||
| Line 260: | Line 359: | ||
== References == | == References == | ||
<references /> | <references /> | ||
| + | |||
| + | [[Category:EGR 103]] | ||
Latest revision as of 23:56, 19 October 2017
There are many problems in engineering that require examining a 2-D domain. For example, if you want to determine the distance from a specific point on a flat surface to any other flat surface, you need to think about both the x and y coordinate. There are various other functions that need x and y coordinates.
Contents
- 1 Note For MAC People
- 2 Individual Patches
- 3 The meshgrid Command
- 4 Examples Using 2 Independent Variables
- 5 Examples Using Refined Grids
- 6 Finding Minima and Maxima in 2-D
- 7 Higher Refinement
- 8 Using Other Coordinate Systems
- 9 Color Maps and Color Bars
- 10 Contour Plots
- 11 Questions
- 12 External Links
- 13 References
Note For MAC People
There is a known graphics issue once a surface has too many nodes. If you get an infinite "Busy" warning or an error about libGL, you need to start your figure with:
figure(1)
clf
set(gcf, 'Renderer', 'ZBuffer')
You may choose to just do this in general for surf, surfc, mesh, or meshc plots to avoid the infinite business error.
Individual Patches
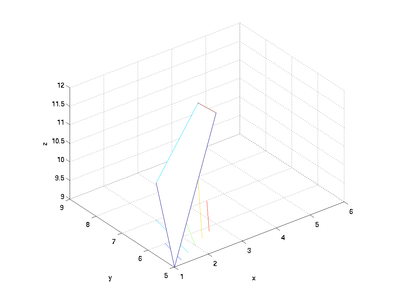
One way to create a surface is to generate lists of the x, y, and z coordinates for each location of a patch. MATLAB will plot intersections at each location specified by the matrices and will then connect the intersections by linking the values next to each other in the matrix. For example, if x, y, and z are 2x2 matrices, the surface commands will generate a single patch:
clear; format short e
x = [ 1  3;...
      2  4];
y = [ 5  6;...
      7  8];
z = [ 9 12;...
     10 11]
meshc(x, y, z)
xlabel('x'); ylabel('y'); zlabel('z');
axis equal; axis([1 6 5 9 9 12])
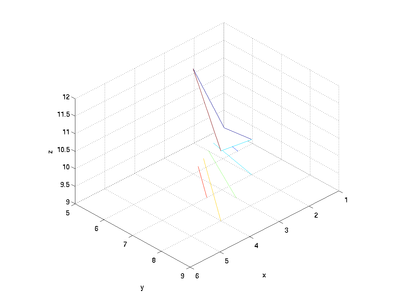
Note that the four "corners" above are not all co-planar; MATLAB will thus create the patch using two triangles - to show this more clearly, you can tell MATLAB to change the view by specifying the azimuth and elevation:
view([136, 32])
which yields the following image:
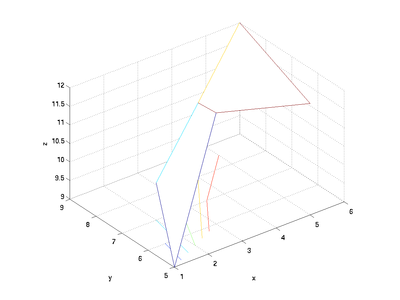
You can add more patches to the surface by increasing the size of the matrices. For example, adding another column will add two more intersections to the surface:
x = [x [ 5;  6]];
y = [y [ 5;  9]];
z = [z [12; 12]];
meshc(x, y, z)
xlabel('x'); ylabel('y'); zlabel('z');
axis equal; axis([1 6 5 9 9 12])
The meshgrid Command
Much of the time, rather than specifying individual patches, you will have functions of two parameters to plot. The meshgrid command is specifically used to create matrices that will represent two parameters. For example, note the output to the following MATLAB command:
[x, y] = meshgrid(-2:1:2, -1:.25:1)
x =

    -2    -1     0     1     2
    -2    -1     0     1     2
    -2    -1     0     1     2
    -2    -1     0     1     2
    -2    -1     0     1     2
    -2    -1     0     1     2
    -2    -1     0     1     2
    -2    -1     0     1     2
    -2    -1     0     1     2

y =

   -1.0000   -1.0000   -1.0000   -1.0000   -1.0000
   -0.7500   -0.7500   -0.7500   -0.7500   -0.7500
   -0.5000   -0.5000   -0.5000   -0.5000   -0.5000
   -0.2500   -0.2500   -0.2500   -0.2500   -0.2500
         0         0         0         0         0
    0.2500    0.2500    0.2500    0.2500    0.2500
    0.5000    0.5000    0.5000    0.5000    0.5000
    0.7500    0.7500    0.7500    0.7500    0.7500
    1.0000    1.0000    1.0000    1.0000    1.0000
The first argument gives the range that the first output variable
should include, and the second argument gives the range that the
second output variable should include. Note that the first output
variable x basically gives an x coordinate and the second output
variable y gives a y coordinate. This is useful if you want to
plot a function in 2-D.
Examples Using 2 Independent Variables
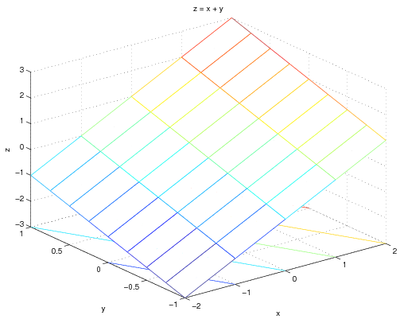
For example, to plot z=x+y over the ranges of x
and y specified above - the code would be:
[x, y] = meshgrid(-2:1:2, -1:.25:1);
z = x + y;
meshc(x, y, z);
xlabel('x');
ylabel('y');
zlabel('z');
title('z = x + y');
and the graph is:
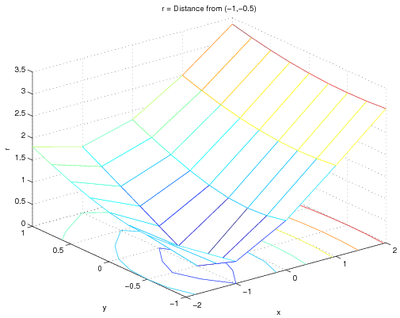
To find the distance r from a particular point, say (-1,-0.5), you just need
to change the function. Since the distance between two points \((x, y)\) and \((x_0, y_0)\) is given by
\(
r=\sqrt{(x-x_0)^2+(y-y_0)^2}
\)
the code could be:
[x, y] = meshgrid(-2:1:2, -1:.25:1);
r = sqrt( (x-(-1)).^2 + (y-(-0.5)).^2 );
meshc(x, y, r);
xlabel('x');
ylabel('y');
zlabel('r');
title('r = Distance from (-1,-0.5)');
and the plot is
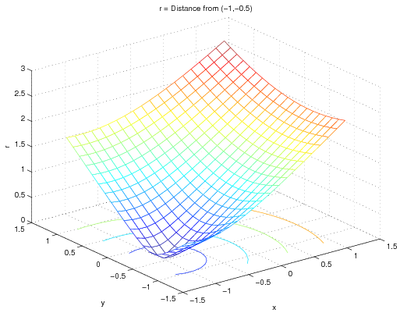
Examples Using Refined Grids
You can also use a finer grid to make a better-looking plot:
[x, y] = meshgrid(linspace(-1.2, 1.2, 20));
r = sqrt( (x-(-1)).^2 + (y-(-0.5)).^2 );
meshc(x, y, r);
xlabel('x');
ylabel('y');
zlabel('r');
title('r = Distance from (-1,-0.5)');
and the plot is:
Note that the meshgrid command was given only one
argument - in that case, the range of x and y will be the same.
Finding Minima and Maxima in 2-D
You can also use these 2-D structures to find minima and maxima. For example, given the grid in the code directly above, you can find the minimum and maximum distances and where they occur:
MinDistance = min(r(:))
MaxDistance = max(r(:))
XatMin = x(find(r == MinDistance))
YatMin = y(find(r == MinDistance))
XatMax = x(find(r == MaxDistance))
YatMax = y(find(r == MaxDistance))
MinDistance =
    0.0782
MaxDistance =
    2.7803
XatMin =
   -0.9474
YatMin =
   -0.4421
XatMax =
    1.2000
YatMax =
    1.2000
You can also use the two-output version of the max and min commands:
[MinDistance, MinIndex] = min(r(:))
[MaxDistance, MaxIndex] = max(r(:))
XatMin = x(MinIndex)
YatMin = y(MinIndex)
XatMax = x(MaxIndex)
YatMax = y(MaxIndex)
Fortunately, because of the way MATLAB pulls the elements from a matrix to a single column, the element numbers for the relevant x and y values will be the same.
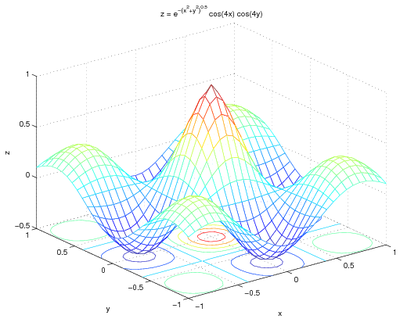
If there are multiple maxima or minima, the find command will
report them all. For example, with the following code,
    [x, y] = meshgrid(linspace(-1, 1, 31));
z2 = exp(-sqrt(x.^2+y.^2)).*cos(4*x).*cos(4*y);
meshc(x, y, z2);
xlabel('x');
ylabel('y');
zlabel('z');
title('z = e^{-(x^2+y^2)^{0.5}} cos(4x) cos(4y)');
MinVal = min(min(z2))
MaxVal = max(max(z2))
XatMin = x(find(z2 == MinVal))
YatMin = y(find(z2 == MinVal))
XatMax = x(find(z2 == MaxVal))
YatMax = y(find(z2 == MaxVal))
which gives a graph of:
the matrix z2 has four entries with the same minimum value and one with the maximum value:
MinVal =
   -0.4699

MaxVal =
     1

XatMin =
   -0.7333
         0
         0
    0.7333

YatMin =
         0
   -0.7333
    0.7333
         0

XatMax =
     0

YatMax =
     0
Higher Refinement
As seen in creating line plots using different scales, you may want to use a more highly-refined grid to locate maxima and minima with greater precision. This may include reducing the overall domain of the function as well as including more points. For example, the changing the grid to have 1001 points in either direction makes for a more refined grid. The code below demonstrates how to increase the refinement:
[xp, yp] = meshgrid(linspace(-1.2, 1.2, 1001));
z2p = exp(-sqrt(xp.^2+yp.^2)).*cos(4*xp).*cos(4*yp);
MinValp = min(min(z2p))
MaxValp = max(max(z2p))
XatMinp = xp(find(z2p == MinValp))
YatMinp = yp(find(z2p == MinValp))
XatMaxp = xp(find(z2p == MaxValp))
YatMaxp = yp(find(z2p == MaxValp))
The results obtained are:
MinValp =
   -0.4703

MaxValp =
     1

XatMinp =
   -0.7248
         0
         0
    0.7248

YatMinp =
         0
   -0.7248
    0.7248
         0

XatMaxp =
     0

YatMaxp =
     0
Note that graphing the more refined points would be a bad idea - there are now over one million nodes and MATLAB will have a hard time rendering such a surface.
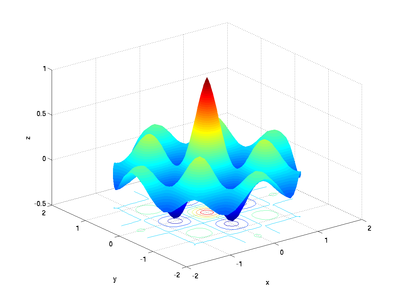
Using Other Coordinate Systems
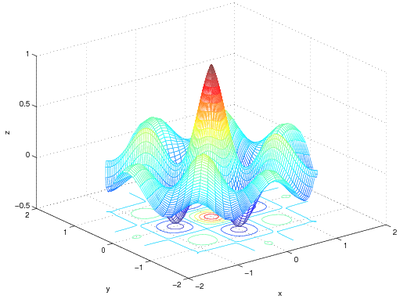
The plotting commands such as meshc and surfc generate surfaces based on matrices of x, y, and z coordinates, respectively, but you can also use other coordinate systems to calculate where the points go. As an example, the surface above could be plotted on a circular domain using polar coordinates. To do that, r and \(\theta\) coordinates could be generated using meshgrid and the appropriate x, y, and z values could be obtained by noting that \(x=r\cos(\theta)\) and \(y=r\sin(\theta)\). z can then be calculated from any combination of x, y, r, and \(\theta\):
 [r, theta] = meshgrid(...
        linspace(0, 1.7, 60), ...
        linspace(0, 2*pi, 73));
x = r.*cos(theta);
y = r.*sin(theta);
z = exp(-r).*cos(4*x).*cos(4*y);
meshc(x, y, z);
x('x');
y('y');
z('z');
produces:
though in this case, an interpolated surface plot might look better:
surfc(x, y, z);
shading interp
xlabel('x');
ylabel('y');
zlabel('z');
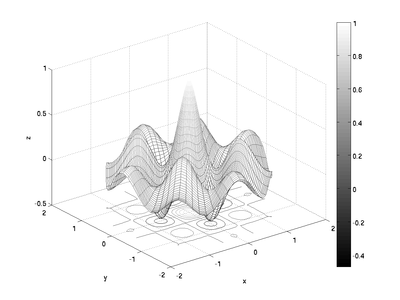
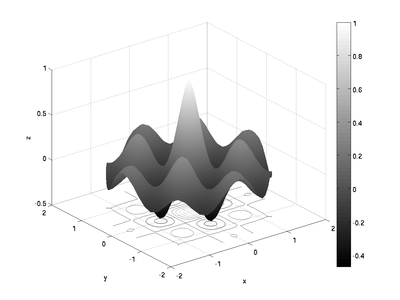
Color Maps and Color Bars
When printing to a black-and-white printer, it might make sense to change the color scheme to grayscale or something other than the default case. The colormap command does this. The different color maps are listed in the help file for color map, as are instructions for how to make your own colormap if you need to.
Along with using a different color map, you may want to add a color bar to indicate the values assigned to particular colors. This may be done using the colorbar command. Continuing on with the examples above:
 [r, theta] = meshgrid(...
        linspace(0, 1.7, 60), ...
        linspace(0, 2*pi, 73));
x = r.*cos(theta);
y = r.*sin(theta);
z = exp(-r).*cos(4*x).*cos(4*y);
meshc(x, y, z);
colormap(gray)
colorbar
x('x');
y('y');
z('z');
produces:
and for the interpolated surface plot:
surfc(x, y, z);
shading interp
colormap(gray)
colorbar
xlabel('x');
ylabel('y');
zlabel('z');
Contour Plots
Information on making contour plots is at MATLAB:Contour Plots.
Questions
Post your questions by editing the discussion page of this article. Edit the page, then scroll to the bottom and add a question by putting in the characters *{{Q}}, followed by your question and finally your signature (with four tildes, i.e. ~~~~). Using the {{Q}} will automatically put the page in the category of pages with questions - other editors hoping to help out can then go to that category page to see where the questions are. See the page for Template:Q for details and examples.
